Important Information
You are visiting the international Vantage Markets website, distinct from the website operated by Vantage Global Prime LLP
( www.vantagemarkets.co.uk ) which is regulated by the Financial Conduct Authority ("FCA").
This website is managed by Vantage Markets' international entities, and it's important to emphasise that they are not subject to regulation by the FCA in the UK. Therefore, you must understand that you will not have the FCA’s protection when investing through this website – for example:
- You will not be guaranteed Negative Balance Protection
- You will not be protected by FCA’s leverage restrictions
- You will not have the right to settle disputes via the Financial Ombudsman Service (FOS)
- You will not be protected by Financial Services Compensation Scheme (FSCS)
- Any monies deposited will not be afforded the protection required under the FCA Client Assets Sourcebook. The level of protection for your funds will be determined by the regulations of the relevant local regulator.
If you would like to proceed and visit this website, you acknowledge and confirm the following:
- 1.The website is owned by Vantage Markets' international entities and not by Vantage Global Prime LLP, which is regulated by the FCA.
- 2.Vantage Global Limited, or any of the Vantage Markets international entities, are neither based in the UK nor licensed by the FCA.
- 3.You are accessing the website at your own initiative and have not been solicited by Vantage Global Limited in any way.
- 4.Investing through this website does not grant you the protections provided by the FCA.
- 5.Should you choose to invest through this website or with any of the international Vantage Markets entities, you will be subject to the rules and regulations of the relevant international regulatory authorities, not the FCA.
Vantage wants to make it clear that we are duly licensed and authorised to offer the services and financial derivative products listed on our website. Individuals accessing this website and registering a trading account do so entirely of their own volition and without prior solicitation.
By confirming your decision to proceed with entering the website, you hereby affirm that this decision was solely initiated by you, and no solicitation has been made by any Vantage entity.
I confirm my intention to proceed and enter this website Please direct me to the website operated by Vantage Global Prime LLP, regulated by the FCA in the United KingdomBy providing your email and proceeding to create an account on this website, you acknowledge that you will be opening an account with Vantage Global Limited, regulated by the Vanuatu Financial Services Commission (VFSC), and not the UK Financial Conduct Authority (FCA).
-
Please enter a valid email address
-
Please tick the checkbox to proceed
-
Please tick the checkbox to proceed
Please tick all to proceed
×
-
 REGISTER
  LOGIN
LOGIN-

View More
SEARCH
Keywords
- Forex Trading
- Vantage Rewards
- Spreads
Popular Search
- Trading Accounts
- MT4
- MT5
- Copy Trading
- Promotions
Thank you for your interest in viewing this course content. To continue, please fill in the form below.
![]()
xxxxxxxxxx
Please enter your name
xxxxxxxxxx
Please enter a valid email
Where did you hear about us ?
Please tick the checkbox to proceed
Demo Account Form
You are not an existing user. Please register to continue.
xxxxxxxxxx
Please enter your frist name
xxxxxxxxxx
Please enter your last name
xxxxxxxxxx
Please enter a valid email
xxxxxxxxxx
Please enter a valid country
No results found
xxxxxxxxxx
Please enter a valid province
No results found
xxxxxxxxxx
No results found
xxxxxxxxxx
Please enter your phone
Please tick the checkbox to proceed
Important
Vantage Global Limited does not accept applications from Australian residents.
Due to regulatory requirements, when you click 'continue' you will be redirected to the Australian website of Vantage, which is operated by Vantage Global Prime Pty Ltd - a company registered in Australia and regulated by the Australian Securities and Investments Commission (ASIC), AFSL no. 428901.
CONTINUEPlease wait
Error! Please try again.
![]()
Thank you
You can proceed and enjoy the course! You will be redirected shortly.

5.1 What is Technical Analysis?
Technical analysis offers a framework for traders to study the price action of an asset. In the context of forex investing, this means looking at the price charts of the currency pairs you are looking to trade, analysing them with the help of tools and indicators.
The idea behind technical analysis is that all market information – and thus trading conditions – is reflected in the price, so all that’s needed is to study the price action and volume of an asset.
Technical analysis focuses on discerning rhythm, flow, and trends in price direction, using historical prices and trading volume. By identifying patterns in price action, a trader can determine the possibility of future price directions.
One often-cited criticism of technical analysis is that it can be highly subjective; two traders may look at the same chart but come to different conclusions.
The disparity is mainly attributable to how a trader makes use of such tools, as well as the tendency for differences in individual interpretations. However, with practice and experience, a trader should be able to increase the accuracy of their interpretations. Learning how successful traders perform and interpret technical analysis can also help accelerate this process.
Traders who rely on technical analysis to guide their trading decisions are known as technical traders.
Check out a more in-depth article on all the basics of technical analysis.
5.2 Candlestick Charts
Technical analysis is performed on a price chart, and the most commonly used type of chart is a Candlestick Chart.
Candlestick charts display the High, Low, Open and Close prices of each trading period in a way that is easy to understand.
By studying the characteristics of individual candlesticks, as well as candlestick patterns, traders can discern important information such as trend reversals, possible incoming price trends, as well as an overview of what happened during the trading period.
Additionally, candlestick charts work well with several other technical analysis tools, such as trendlines, support and resistance levels, and moving averages.
Revisit Module 3: Essentials of Chart Reading for a recap on candlestick charts and patterns.
5.3 Trendlines
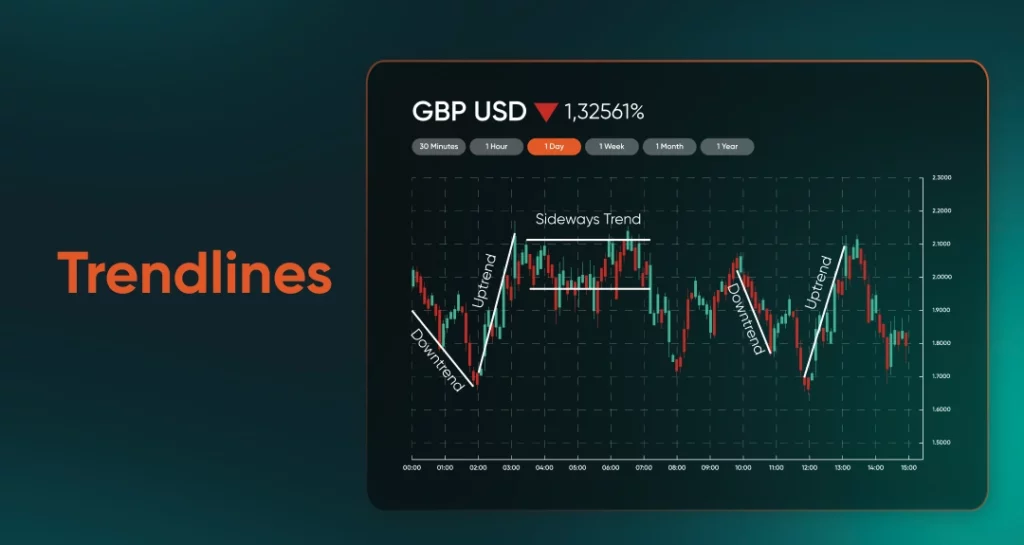
Charting trendlines can help us visualise price trends of a forex currency pair. In the example above, notice how there are three trendlines shown: from left to right – a downtrend, then a sideways trend or range, followed by an uptrend.
Technical analysis is about determining the possibility of price trends based on past movement. Hence, you can use trendlines plotted on a trend that has already happened to forecast the likely high or low point of a similar trend that is forming.
Trendlines are plotted freely; you can choose the start and end point of a trendline, and draw it up, down or sideways, in accordance with the tops and bottoms of the candlesticks that the trendline is describing.
In general, the longer the time period in between, the more accurate the trendline tends are likely to be.
5.4 Support and resistance
Besides charting uptrends, downtrends or sideways trends, trendlines are also useful for visualising levels of support and resistance.
We know that price assets such as forex pairs tend to zigzag up and down, but there are periods in which the price only goes up (or down) to a certain level, and not beyond.
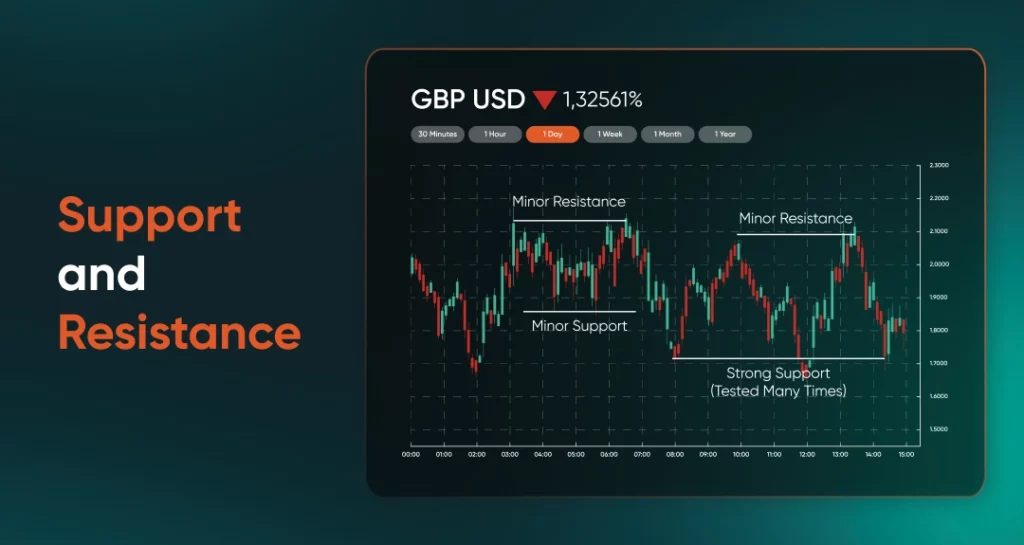
In the example above, the long, red line at the top of the chart shows the price ceiling, which is the highest price where the asset seems to reach. This is known as a level of resistance.
Conversely, the short, red line in the bottom right shows the price floor which is the lowest price that the asset falls to, but no further. This is known as a level of support.
Depending whether the market is bullish or bearish, levels of support and resistance can be broken through and switch places.
During a bullish trend when the market is going up, the price of the asset can break through the ceiling to chart new highs. Provided the price does not fall back under, the resistance level becomes a new support level.
During a bearish trend when the market is going down, the price of the asset can break through the floor to chart new lows. Provided the price does not climb back up again, the support level becomes a new resistance level.
Charting levels of resistance and support can be helpful in several ways, including minimising risks when trading.
5.5 Relative Strength Index (RSI)
The Relative Strength Index (RSI) is a widely used technical indicator used to discern when the market is oversold or overbought.
The RSI is presented as a scale from 0 (oversold) to 100 (overbought), making it an easy-to-use tool for traders who want to buy low and sell high. Common levels to pay attention to are 30 and 70.
Typically, you are able to set an RSI alert for when a currency pair’s value hits a certain threshold. However, the RSI alone should not be the sole indicator that you base your trading decisions upon, as it has been known to be inaccurate, especially during times of volatility.
Instead, RSI alerts should be the signal to start investigating a potential trading opportunity.
5.6 Moving Average
A moving average in technical analysis is used to filter out noise in price data by creating a constantly updated average price. It is a lagging indicator that relies on past prices to identify the trend direction of a currency pair, or to find levels of support or resistance.
Moving averages can be calculated any length of time, but the most widely used moving averages are the 50-day and the 200-day moving averages, as they are considered important trading signals.
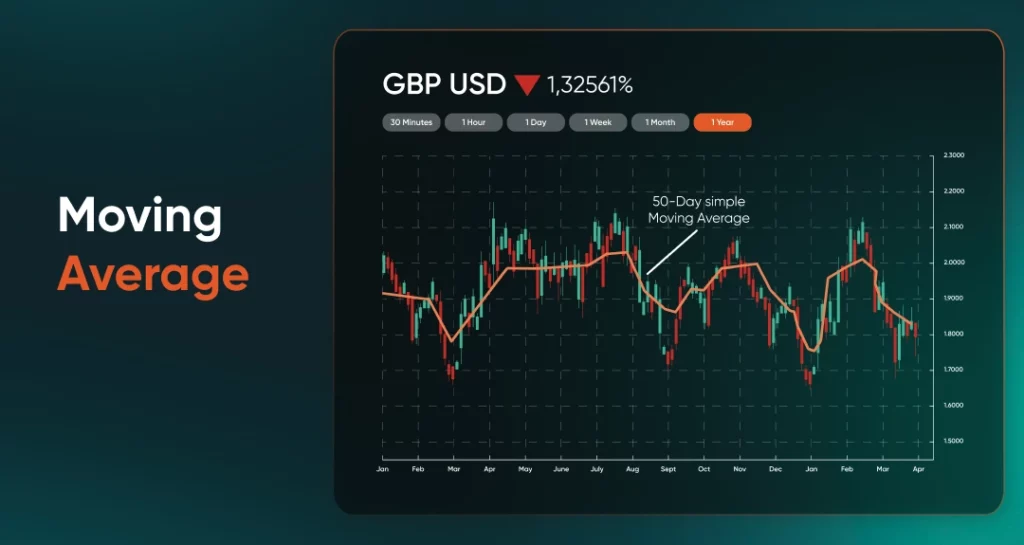
In the example, above, the blue line is the 50-day moving average. As you can see, it’s helpful in charting price trends, showing clearly periods of rising and falling trends.
Traders can use a pair of moving averages – one with a shorter lag (50-day) and one with a longer lag (200-day) to identify trend reversals. When the shorter moving average crosses above the longer-term one, a bullish trend is indicated. When it crosses below, a bearish trend is indicated.
There are two types of moving averages – a simple moving average (SMA) and an exponential moving average (EMA). The first is a simple arithmetic average of prices over a timespan, whereas in the second, greater weight is placed on more recent prices than older ones over the time period.
5.7 Fundamental Analysis vs Technical Analysis
Fundamental analysis revolves around analysing macroeconomic data and global news that could impact the valuation of a country’s currency as a way to make informed trading decisions.
In contrast, technical analysis relies on analysing price charts with the help of charting tools and indicators to understand the trading environment and look for potential trading opportunities.
Given that both have vastly distinct approaches and theories, which one should you use?
Well, fundamental analysis and technical analysis each have their own strengths and weaknesses, and can complement each other.
For instance, let’s say that the U.S. election is drawing near, an event expected to push the US Dollar higher. A trader might take note of this political event and start looking for potential trading opportunities.
Next, a trader may turn to technical analysis, trying to find indications that would confirm the prevailing bullish thesis. If the technical indicators fail to show convincing signals, or display conflicting ones, there may be a deeper story that could cause the intended trade to go against the trader.
In this case, the trader should reconsider their trading thesis, or make arrangements to hedge against uncertainty and risk.
As a beginner forex trader, it is a good idea to become familiar with both fundamental analysis and technical analysis. This will give you a broader suite of foundational skills from which to draw with as you deepen your knowledge and grow as a forex trader.
Check out a more in-depth article on all technical indicators.

Module Recap
- Technical analysis is a framework for traders to study the price action of a currency pair. Charting tools and technical indicators are commonly involved, and a trader who makes trading decisions mainly via technical analysis is known as a technical trader.
- Using historical price and trading volume data, technical analysis allows a trader to discern the possibility of future price trends and events.
- Technical analysis is often criticised for being too subjective; this is thought to arise from differences in how charting tools are employed, as well as differences in individual interpretations.
- Technical analysis is most commonly done on a candlestick chart, where traders can study individual candlestick characteristics and candlestick patterns to identify potential price reversals and incoming price trends.
- Trendlines can be plotted on a price chart to better visualise price trends – uptrends, downtrends and sideways trends. This can help minimise risk.
- Trendlines are also used to demarcate levels of support and resistance. Support levels represent a price floor, whereas resistance levels represent a price ceiling.
- Depending on the state of the market, support and resistance levels may be broken. When price rises above resistance levels during a bullish trend, the level turns into a new support level. When price falls below support levels during bearish trend, the level turns into a new resistance level.
- The Relative Strength index is widely used to signal when the market is overbought or oversold. It is displayed as a number from 0 (oversold) to 100 (overbought). Typically, traders pay attention to levels 30 and 70 on the RSI.
- A moving average filters out noise on the price chart by creating a constantly updated average price. It is a lagging indicator that relies on past prices to identify the trend direction of a currency pair, or to find levels of support or resistance.
- A pair of moving averages can also be used to discern price trends. For instance, when a 50-day moving average (shorter lag) crosses above a 200-day moving average (longer lag), a bullish trend is indicated. When it crosses under instead, a bearish trend is indicated.
- A simple moving average is a simple arithmetic average of prices over a timespan. An exponential moving average accords more weight to recent prices over older ones in the time range.
- While fundamental analysis and technical analysis are two very distinct approaches to trading analysis, traders can benefit from both methods. Learning both will provide a trader with a richer foundation to draw upon.
Previous Lesson
Next Lesson